Excel is a very powerful tool once you get to know it. I don’t know that much, actually, but I have developed a few tools to keep track of design traffic and time. Last year I wrote about time measurement and mentioned briefly how to go about tracking time and tasks.
Today I want to go deeper and share with you a tool I created to track the time and activities you do on a daily basis.
It’s pretty simple. With it you can:
· Establish categories for your activities.
· Know how much time you’re spending in such activities, and filter by category.
· Find out if you’re wasting time in meaningless tasks.
· Find out if there are tasks you can delegate, empowering your employees.
· Measure how much time you’re spending at the office.
Also, as I said in the article I mentioned earlier:
You may find that it's more effective to hire a consultant to take care of certain time consuming activities or you may even ask for your suppliers to absorb such activities which would make your operation even more effective.
You need to be aware of how long do your typical projects take, in order to have accurate planning, and how much to charge.
You can plan more strategically ahead of time so that you know if you need to get some outside help for that big project that will be coming next week or if you have some free time to spend on leadership activities with your staff. In other words, when you know how long will your projects take and how they're organized in any given time frame, you get a broader vision of your business.
So without further ado, here’s the tool and the instructions:
I call it my "Follow Up Activities" spreadsheet. You can download the Excel file here. This is the file as I use it, and this file has been filled for activities for five days, as an example, but feel free to adapt it to your needs!
It’s basically a table with the following fields: Month, Day, Start, Duration, Category, Description and Comments.
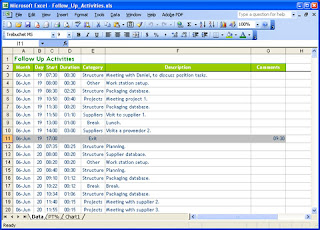
Month: This is a text field. I like to name it "00-mmm" where “00” is the number of the month (for instance June would be 06) and “mmm” is the first three letters of the month’s name. Why? Because it allows me to sort by number of the month, instead of the name, so that January will always be at the top, for example.
Day: This is a number field. Type number of the current day.
Start: This is a date/hour field. Type the hour of the day in which that particular activity started, in 24 hour format.
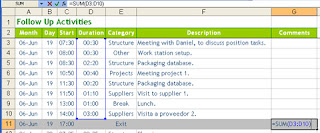
Duration: It’s a date/hour field, with a formula where the duration of the activity is calculated by the starting time of the following task minus the starting time of the previous task. In the picture above the formula would be =C4-C3 for the first cell and then that is copied down on the cells of the D column.
Category: This is a text field. You define the categories of activities. In this example I’ve created seven categories. There’s one called “Breaks” where I record the times I spend on breaks and lunches.
Description: This is a text field. Type a description of the task. I use the same name for the same activity for example I always write “Packaging database” for that particular activity instead of using several different names for it.
Comments: This is a text field. If you wish to add something else like who you met with or if the project was billed, etc.
Now for some instructions:
· Data should be input by the minute, every time you change activity, you need to go there and input that information. This is key, and it needs to be done rigorously and with discipline. This way you always have current information and you're not stuck with having to type several days worth of information.
· The last activity of the day is called “Exit”. You only type the start time, but you must erase the formula in the “Duration” field for this activity.
· When the day ends, I like to use the “Comments” cell of the activity to add up the total hours I spent at the office that day. This is just a SUM formula that adds up the duration of all the activities. For instance in this particular day I was at the office nine and a half hours.
· There’s another worksheet in the Excel file, called "PT%", where I’ve added a Pivot Table report that will tell me how much time I’ve spent in each category or task. Pivot Tables are dynamic, and I can change the fields at leisure. For instance, instead of percentage, I can change it to hours.
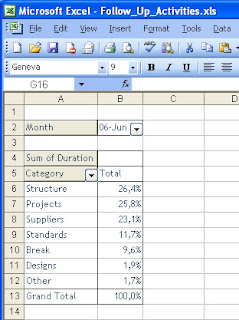
· And I’ve also added a graph to illustrate those times.

Neat, huh? Well, I think so. Do leave some comments if you have some ideas about how to improve this tool!
All the best!
All the best!
Resources: PivotTable reports 101.


No comments:
Post a Comment